Figure 3


Pilot Genomic DNA Hybridizations.  The
  pilot <i>P. aeruginosa</i> spotted oligo array was hybridized with labeled
  genomic DNA from PAO1 (left) or PA14 (right) to assess the ability to utilize
  this array for genomic typing of unknown strains.  95 probe sequences were
  designed to hybridize to regions present in both strains, in one but not the
  other strain, or in neither strain (but present in another
  <i>P. aeruginosa</i> strain).  The last (96th) data point in each graph
  corresponds to a blank with no spotted oligo.  Turquoise bars below each
  graph indicate probes corresponding to sequences present in the strain.
  Since the average intensities for the two genomic DNA samples differred, an
  arbitrary cut-off to assign sequences as present or absent was not based on
  absolute intensities, but rather normalized values in the following manner:
  each intensity was divided by the average intensity for the entire sample to
  adjust for overall intensity differences between samples, and any probe with
  an adjusted intensity greater than an 0.5 was defined as present in the
  genome (data not shown).  Using this criterion, 94% of the probes were
  correctly assigned for PAO1 (6 probes in regions absent in PAO1 were
  incorrectly assigned as present) and 94% of the probes were correctly
  assigned for PA14 (3 probes in regions present in PA14 were incorrectly
  assigned as absent, and 3 probes in regions absent in PA14 were incorrectly
  assigned as present).  Incorrect assignments based on this arbitrary cut-off
  are indicated by white circles.
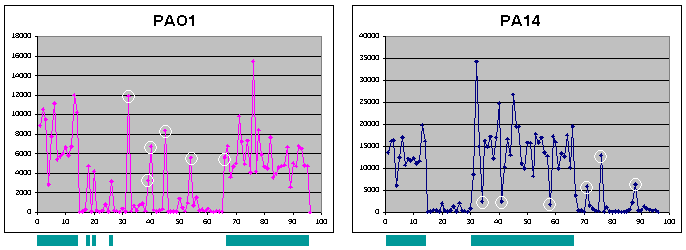
Figure 3 - Pilot Genomic DNA Hybridizations. The pilot P. aeruginosa spotted oligo array was hybridized with labeled genomic DNA from PAO1 (left) or PA14 (right) to assess the ability to utilize this array for genomic typing of unknown strains. 95 probe sequences were designed to hybridize to regions present in both strains, in one but not the other strain, or in neither strain (but present in another P. aeruginosa strain). The last (96th) data point in each graph corresponds to a blank with no spotted oligo. Turquoise bars below each graph indicate probes corresponding to sequences present in the strain. Since the average intensities for the two genomic DNA samples differred, an arbitrary cut-off to assign sequences as present or absent was not based on absolute intensities, but rather normalized values in the following manner: each intensity was divided by the average intensity for the entire sample to adjust for overall intensity differences between samples, and any probe with an adjusted intensity greater than an 0.5 was defined as present in the genome (data not shown). Using this criterion, 94% of the probes were correctly assigned for PAO1 (6 probes in regions absent in PAO1 were incorrectly assigned as present) and 94% of the probes were correctly assigned for PA14 (3 probes in regions present in PA14 were incorrectly assigned as absent, and 3 probes in regions absent in PA14 were incorrectly assigned as present). Incorrect assignments based on this arbitrary cut-off are indicated by white circles.