Figure 1


Alignments of the PA14 and PAO1
  genomes. Black vertical lines in the PA14 genome represents regions that are
  inverted relative to the PAO1 genome.  Purple vertical bars (highlighted by
  purple arrows) indicate regions of each genome that are absent in the other.
  A magnified view of the largest PA14-specific region (PAPI-1) is shown at the
  top.  Black arrows indicate the positions of transposon insertions within
  ORFs of unknown function that were tested in a murine sepsis model of
  infection. The percent mortality for each tested mutant is shown (under
  conditions for which wild-type PA14 results in 100% mortality).
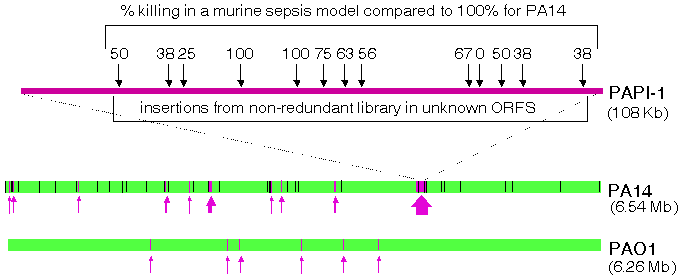
Figure 1 - Alignments of the PA14 and PAO1 genomes. Black vertical lines in the PA14 genome represents regions that are inverted relative to the PAO1 genome. Purple vertical bars (highlighted by purple arrows) indicate regions of each genome that are absent in the other. A magnified view of the largest PA14-specific region (PAPI-1) is shown at the top. Black arrows indicate the positions of transposon insertions within ORFs of unknown function that were tested in a murine sepsis model of infection. The percent mortality for each tested mutant is shown (under conditions for which wild-type PA14 results in 100% mortality).